This section presents a set of static workflow scenarios that illustrate common execution patterns in hybrid Quantum–HPC systems.
Each scenario uses simplified, step-by-step diagrams to show how classical HPC resources and quantum resources (QPU) interact over time. It also shows where execution stalls arise, and how orchestration choices shape overall utilization.
The scenarios are directly motivated by — and map back to — some of the bottlenecks discussed in the accompanying article:
Hybrid Quantum–HPC Systems: Bottlenecks, Tradeoffs, and Practical Solutions
They are intended to provide conceptual orientation, not performance prediction.
Scenario Overview
| Scenario | Short Name | Focus / What You Learn | Dominant Bottleneck (Article) | Example Use Cases |
|---|---|---|---|---|
| A | Idealized Baseline | What a clean, loosely coupled hybrid run looks like | None (reference case) | toy examples, demos, low-frequency QC calls, one-off runs |
| B | Synchronization Wall | How global barriers force HPC-wide waiting | Bottleneck 3 (synchronization + serial QC) | VQE, QAOA, variational optimization, collective updates |
| C | Latency / Data Wall | How data transfer & control overhead dominate fast jobs | Bottleneck 1 (latency / data movement) | Monte Carlo, genomics, multi-omics, PDE state exchange |
| D | Throttled Execution | Why rate-limiting is required even without synchronization | Bottleneck 3 (serial service capacity) | batched VQE, kernel evaluation, high-throughput hybrids |
The scenarios are ordered to progressively introduce tighter coupling and stronger constraints between classical and quantum execution. Together, they form a visual companion to the bottleneck analysis in the Medium article.
An interactive Quantum–HPC Workflow Explorer that allows users to experiment with orchestration parameters (queue limits, latency, submission rate) is under development and will be linked here when available.
Diagram Legend
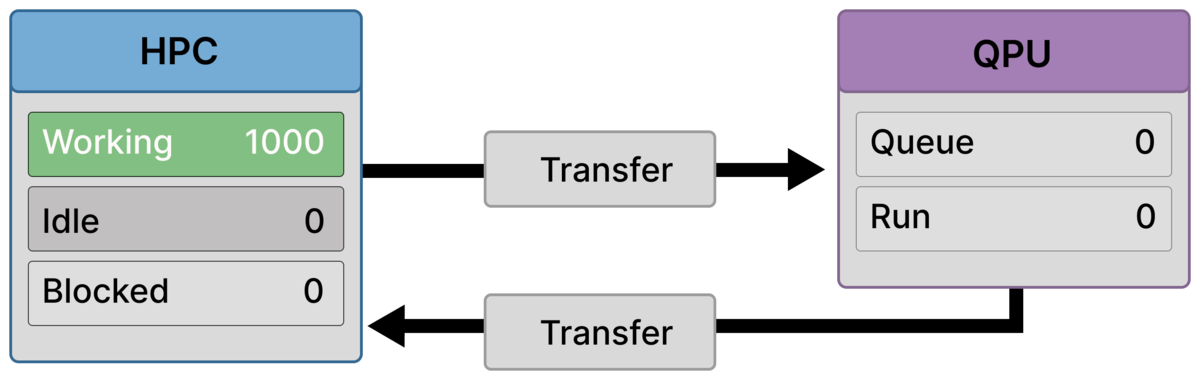
Example reference diagram used to explain visual conventions.
How to Read the Workflow Diagrams
All scenarios in this section use the same visual conventions.
Color Coding
Green boxes indicate an active state.
Grey boxes indicate an inactive state.
Numerical Labels
On the HPC side, numbers represent the count of ranks in a given state.
On the QPU side, numbers represent the count of quantum jobs in that state.
State Definitions (Used Consistently)
The following state definitions apply across all scenarios.
HPC States
Working
Rank is performing classical computation (preprocessing, postprocessing, optimization).Blocked
Rank has submitted a quantum job and is waiting for its own quantum result.Idle
Rank has no classical work to do and is not submitting quantum jobs.
Transfer
Transfer (arrows)
Transfer denotes the full data movement phase from the start of off-load on the HPC side until the payload has fully arrived at the QC side. During Transfer, a rank may be Working (while performing off-load) or Blocked (once off-load has completed and no further action is possible).
QPU States
Queue
Quantum jobs that have arrived but are not yet executing.Run
Quantum job currently executing (at most one).